Fun with Automagical OTDR Trouble-shooting
November 22, 2017 / General, Installation and testing, Upgrading and troubleshooting, Industrial Networks
I had a fun tech support call the other day that I think you will find interesting. A customer sent one of the ugliest traces we had seen in a while. “Help! What is going on here?” This came with the usual, it is urgent, his boss will kill him, the network is down, and he saw a dog and a cat making friendly on the way home from the job site.
Send us the trace file, better, please send it to us in the native, .flw, format. There is a lot of information in there that is very helpful to us, such as, what tester you are using, what firmware it has, and, what the failure is.
OTDR traces can be tricky to interpret, and people who have experience doing so can be valuable. Modern OTDR’s usually offer some kind of software package that can help with these interpretations. The Fluke Networks Optifiber Pro comes with an “Expert Module”, named EventMap that can help you to interpret your fiber optic traces. This is our third generation of an expert trace interpreter and it works pretty well.
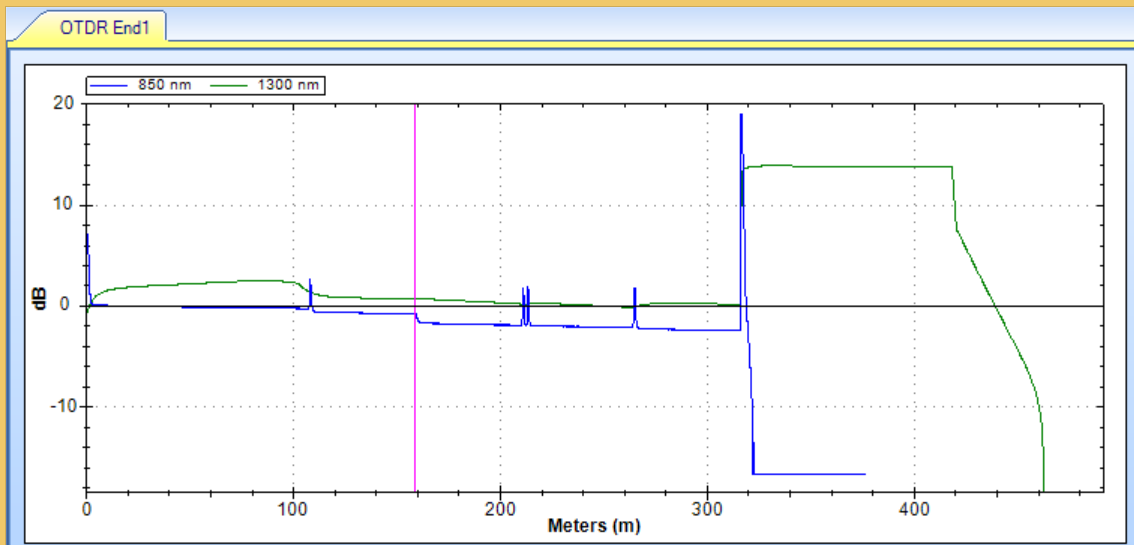
In this case, at first glance, it looked like it may have let down this customer. Here is a similar trace to what they sent us:
And here was the Event Map:
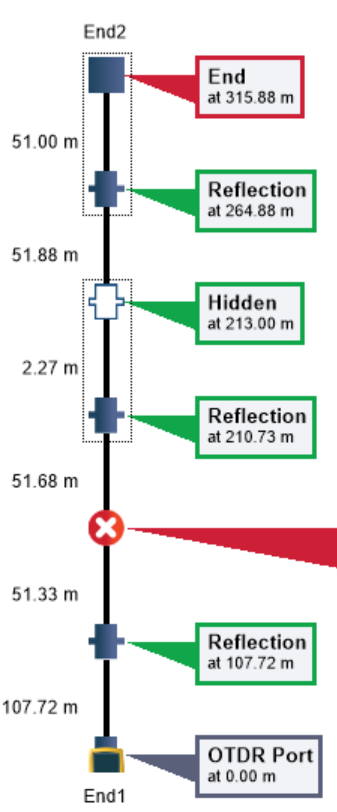
Whenever I see an event map like this, a little warning bell rings in my head. First, let us not worry about the events that are happening 200 meters down the fiber; let us worry about the first events. Looking through a fiber is a lot like looking through a window, it is glass. If the glass is dirty or cracked, it is hard to see what is happening outside.
The other thing that I want to look at is the configuration the Expert Module decided on. It is helpful to have the OTDR decide what range to use, what pulse width and averaging time. You can always play around with these in manual mode if you would rather, but most of the time, the Automatic mode does a good job of finding your problem, or, better, finding out the problem is not with the cabling.
With the trace, it was clear that the manual mode had selected a really wide pulse at 1300 nm, hence the unusual looking trace. I confirmed this by looking at the test settings.
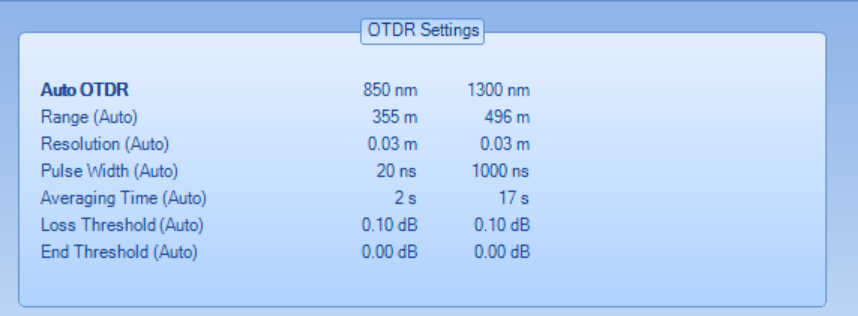
First, we can see that they were working in the Automatic mode, “Auto OTDR”. At the 850 nm wavelength, the OTDR chose a 20 ns pulse, but at 1300 it picked 1000 ns, very large. There was a time when I would criticize the OTDR and say, “what were you thinking?!?” with those configurations, but I have learned, it is making a best effort with what it can find. It is saying, I would like to solve every event down the fiber in one try, but I just cannot see past an event that is X meters down the fiber.
That was very much the case here. Something was happening 159 meters down the fiber, 51 meters past the launch fiber, and until we resolved that, the rest of the trace just did not matter. There was no combination of pulse width and averaging time that was going to penetrate this event and give us a clean trace.
We answered the customer and asked them to look at this spot on their link. Sometimes there is not closure on the tech support calls we get. If we solve the customer’s problem, they do not let us know and we are left hanging. In this case, the customer did get back to us. There were a series of mechanical splices, one right next to the other. They took those out and put in a single fusion splice, and the link came back up, the boss stopped yelling, about this incident, and dogs and cats went back to fighting.
In conclusion, the EventMap expert module is a great help for OTDR trace analysis. If you get an event map that seems wrong, or has too many events, start with the first ones and move forward from there. If the window is dirty, it is hard to tell what is going on further down the fiber.
Recent Posts See All >
What Is Fiber Optics? A Guide
2024-03-20
Choosing Stranded vs. Solid Wire Cable
2024-03-06
What Is Return Loss?
2023-02-14
More General Posts See All >
What Is Fiber Optics? A Guide
2024-03-20
Choosing Stranded vs. Solid Wire Cable
2024-03-06
What Is the Right Way to Test an MPTL?
2023-08-22


©2006-2021 Fluke Corporation。保留所有权利。
RM2011, 20/F, SCITECH Tower, 22 Jianguomenwai Avenue, Chaoyang District, Beijing, China
地址:北京市朝阳区建国门外大街22号赛特大厦20层2011室
联系电话:400-8103435
沪ICP备11037028号-15![]()