Cabling Mistakes #5: Forgetting to Enable Plot Data
January 25, 2016 / General, Standard and Certification, Installation and testing, Best Practices
While the smart people who install, test and certify network cabling plants know the importance of meeting standards performance parameters and ensuring application support, even the best of us can make mistakes that adversely impact the bottom line and customer satisfaction.
Let’s take a look at the #5 Dumb Thing that smart people do when testing network cabling systems—forgetting to enable plot data
What is Plot Data?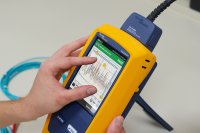
Plot data is the full color graphical depiction of measured test parameters required for certification testing. For copper certification, plot data includes graphs for key parameters, including Insertion Loss (IL), Return Loss (RL), Near End Crosstalk (NEXT), Power Sum NEXT, Attenuation to Crosstalk Ratio (ACR-N), Power Sum ACR-N, Far End ACR-F, Power Sum ACR-F, Power Sum Alien Near End Crosstalk (PS ANEXT) and Power Sum Alien Crosstalk Ratio Far End (PS AACR-F).
Each of these graphs shows the values in decibels (dB) as they vary by frequency—the horizontal axis is frequency and the vertical axis is dB. The horizontal axis will vary depending on the type of cabling being tested. It will run to 100 MHz for Category 5e, 250 MHz for Category 6, 500 MHz for Category 6A and so on. (You can also extend the frequency that you want to test to, which can be handy for recertifying a cable to a higher standard.)
For each graph, the smooth red line shows the testing limits of the standard you’re testing to (i.e., TIA, ISO/IEC, etc.). The jagged color lines show the results for individual pairs and pair combinations. These lines are jagged since actual results tend to have peaks and valleys, which is not a problem as long as they stay above the limit.
Better Than a Thousand Words
In the case of plot data, a picture is better than a thousand words. It shows valuable visual information about the performance of individual pairs within the cable with respect to the test limits. Your 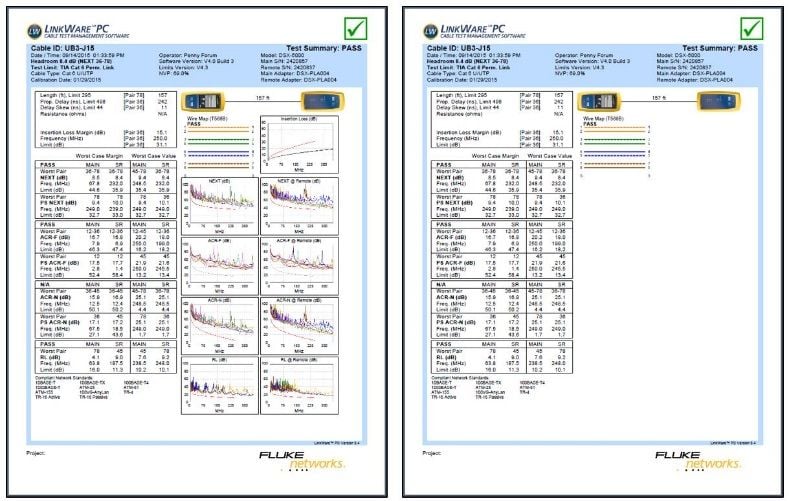 customer will appreciate being able to visually see the headroom—reports without plot data will look empty.
Plot data is also the only way to really tell what might be causing an issue with your link under test, and it is required for relating test results to distance. Measurements made based on frequency are great for certification, but are of little use for diagnostic purposes. It’s important to see where the crosstalk is happening so the failing link can be fixed or replaces. That’s where time domain data comes into play, which is achieved based on the knowledge of the speed at which electrical signals travel over copper cabling.
For example, Fluke Networks’ DTX 5000 CableAnalyzer™ use a patented digital signal processing technique to report the distance to a location on the link under test where crosstalk or return loss is excessive. The two parameters that show the time domain information are HDTDX (High Definition Time Domain Crosstalk) and HDTDR (High Definition Time Domain Reflectometry). Plot data must be enabled for these two parameters to be saved in the results.
Simply Required
Another reason for enabling plot data is that is it required for Alien Crosstalk certification testing of Category 6A cabling. Furthermore, if you need Fluke Networks’ troubleshooting support and you don’t have plot data, we will ask you to retest with it enabled, more than doubling your test time. Our experts cannot analyze testing results without it.
The default under instrument settings for the DTX 5000 CableAnalyzer sets plot data to “standard” for displaying and saving plot data for frequency-based tests required by the selected test limit. As a minimum, we recommend keeping it that way. Choosing “extended” will save data beyond the frequency range required by the selected test limit.
Recent Posts See All >
What Is Fiber Optics? A Guide
2024-03-20
Choosing Stranded vs. Solid Wire Cable
2024-03-06
What Is Return Loss?
2023-02-14
More General Posts See All >
What Is Fiber Optics? A Guide
2024-03-20
Choosing Stranded vs. Solid Wire Cable
2024-03-06
What Is the Right Way to Test an MPTL?
2023-08-22


©2006-2021 Fluke Corporation。保留所有权利。
RM2011, 20/F, SCITECH Tower, 22 Jianguomenwai Avenue, Chaoyang District, Beijing, China
地址:北京市朝阳区建国门外大街22号赛特大厦20层2011室
联系电话:400-8103435
沪ICP备11037028号-15![]()